| 일 | 월 | 화 | 수 | 목 | 금 | 토 |
|---|---|---|---|---|---|---|
| 1 | 2 | 3 | 4 | 5 | 6 | 7 |
| 8 | 9 | 10 | 11 | 12 | 13 | 14 |
| 15 | 16 | 17 | 18 | 19 | 20 | 21 |
| 22 | 23 | 24 | 25 | 26 | 27 | 28 |
- python
- 블록체인
- 파이썬
- it
- 프로그래밍
- 자동매매
- can
- 비트코인
- toefl writing
- 암호화폐
- 오토사
- 실시간시스템
- AWS
- TOEFL
- realtimesystem
- 확률
- backtrader
- 퀀트
- 토플
- 임베디드
- 자동차sw
- 아마존 웹 서비스
- 클라우드
- AUTOSAR
- 토플 라이팅
- GeorgiaTech
- probability
- Cloud
- 개발자
- 백트레이더
- Today
- Total
Leo's Garage
BackTrader - 여러 지표 섞어서 만들기 (3) 본문
이번에는 여러 지표를 섞어서 매매 전략을 만들어보도록 하겠다.
이번 전략에는 기본적으로 SMA(Simple Moving Average)와 MACD(Moving Average Convergence Divergence) 그리고 RSI(Relative Strength Index) 이 세 가지 지표를 섞어서 전략을 만들어보려고 한다.
각 지표에 대한 설명 및 동작에 대한 내용은 아래 포스팅들을 참조하기 바란다.
BackTrader - MACD 활용
이번에는 MACD를 활용해서 전략을 작성해보겠다. MACD(Moving Average Convergence Divergence)는 장단기 이동평균선(SMA) 차이를 이용해서 매매신호를 포착하는 기법이다. MACD의 원리는 장기 이동평균선과 단
downyk.tistory.com
BackTrader - RSI 지표를 이용한 매매
RSI(relative strength index) - 상대강도지수 이다. RSI는 가격의 상승압력과 하락압력간의 상대적인 강도를 의미한다. 즉, 이 종목이 과매수인지 과매도인지 나타낸다. RSI를 이용한 간단한 전략은 아래
downyk.tistory.com
BackTrader - 골든 크로스 / 데드 크로스 전략
이번에는 골든 크로스와 데드 크로스를 이용해서 간단한 전략을 만들어보자 이번에 작성할 전략은 두 개의 이평선이 서로 교차하는 지점을 기준으로 매수 / 매도를 하려고한다. 하나는 20일선,
downyk.tistory.com
이번에 만들 전략은 아래와 같다.
MACD와 RSI 둘 다 특정 임계점(Threshold)을 넘어 위로 가면 전략은 매수한다.
MACD와 RSI 둘 중 하나라도 특정 임계점(Threshold) 아래로 가면 매도한다.
그리고 Take_Profit과 Stop_loss 비율을 사전에 정의하여 해당 조건 시 매도하도록 전략을 구성한다.
import backtrader as bt
import yfinance as yf

class ReverseTrendStrategy(bt.Strategy):

    params = (
        ("fast_window", 12),
        ("slow_window", 26),
        ("macd_window", 9),
        ("macd_threshold", 0.0),
        ("rsi_window", 14),
        ("rsi_threshold", 50),
        ("stop_loss", 2.0),
        ("take_profit", 5.0),
    )

    def __init__(self):
        self.fast_average = bt.indicators.SimpleMovingAverage(
            self.data.close, period=self.params.fast_window
        )
        self.slow_average = bt.indicators.SimpleMovingAverage(
            self.data.close, period=self.params.slow_window
        )
        self.macd = bt.indicators.MACD(
            self.data.close,
            period_me1=self.params.fast_window,
            period_me2=self.params.slow_window,
            period_signal=self.params.macd_window,
        )
        self.rsi = bt.indicators.RelativeStrengthIndex(
            self.data.close, period=self.params.rsi_window
        )

    def next(self):
        if not self.position:
            if self.macd.macd[0] > self.params.macd_threshold and self.rsi[0] > self.params.rsi_threshold:
                self.buy()
        else:
            if self.macd.macd[0] < self.params.macd_threshold or self.rsi[0] < self.params.rsi_threshold:
                self.sell()
            if self.data.close[0] < self.data.close[-1] * (1 - self.params.stop_loss / 100):
                self.sell()
            if self.data.close[0] > self.data.close[-1] * (1 + self.params.take_profit / 100):
                self.sell()


cerebro = bt.Cerebro()

data = bt.feeds.PandasData(dataname= yf.download('TSLA','2021-01-01','2021-12-31'))
cerebro.adddata(data)

cerebro.addstrategy(ReverseTrendStrategy)

cerebro.run()

cerebro.plot()
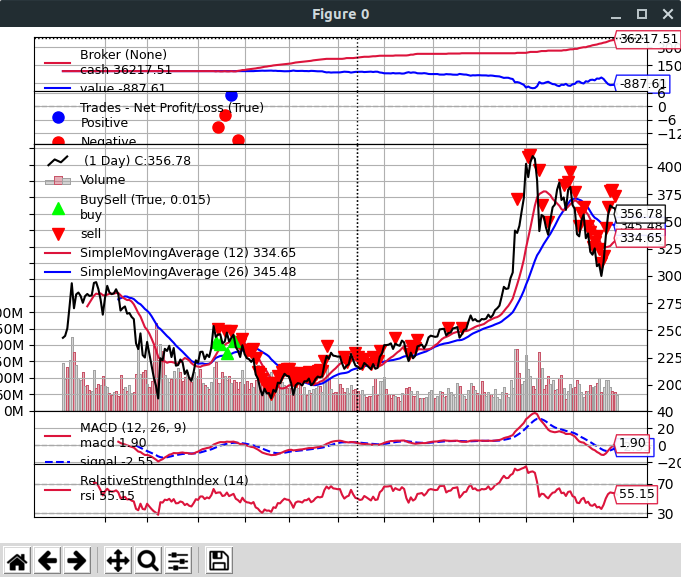
코드는 위와 같고 해당 코드를 Tesla 1년치 주가에 반영해보았다.

초기 자본은 10000이었는데 1년 뒤에 36217.51이 되었다.
약 3배 이상의 수익을 얻었다고 볼 수 있다.

